SLOPE Function in Excel
The SLOPE function in Excel is categorized as a statistical function in Excel. In mathematical terms, the SLOPE returns the slope of a line between given data points in known y’s values and known x’s values. The slope of a linear regression line is the vertical distance/the horizontal distance between any of the two points on this line.
Download FREE SLOPE Function Excel Template and Follow Along!
Download Excel TemplateFor example, we have two sets of values, known_y’s (5,2,7,3 from B1 to B4) and known_x’s (8,3,5,6 from C1 to C4). So, we need to calculate these two ranges’ slopes using the Excel SLOPE function.
=SLOPE(B1:B4,C1:C4)
= 0.42.
The SLOPE function returns the slope of a regression line based on the data points recognized by known_y_values and known_x_values.
SLOPE Formula in Excel
The SLOPE function has two critical parameters: known_y’s and known_x’s.
Compulsory Parameter:
- known_y’s: It is an array of known y-values.
- known_x’s: It is an array of known x-values.
Here, the length of the known_x’s data array should be the same as known_y’s data array. In addition, the value of the variance of the known x’s values must not be 0.
Remarks:
The SLOPE equation to find out the slope of the linear regression line is as follows:

where ![]() and
and ![]() are the sample means calculated by average(x values) and average(y values).
are the sample means calculated by average(x values) and average(y values).
SLOPE Function in Excel Explained in Video
How to Use the SLOPE Function in Excel?
It is very simple and easy to use. Let us understand the working of the SLOPE function in some examples. It can be used as a worksheet function and as a VBA function.
Example #1
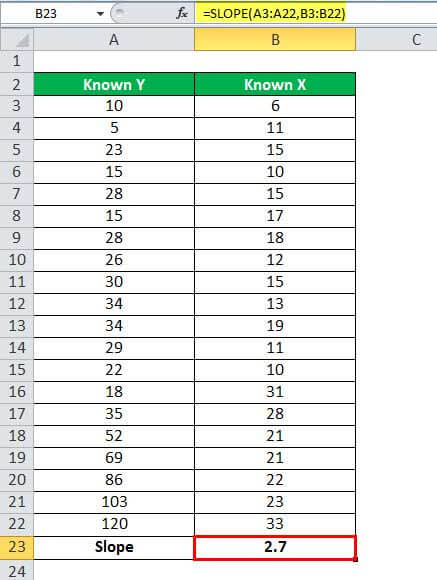
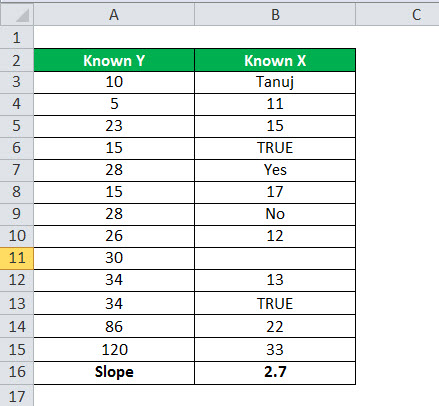
In the first example, we have two data sets with the known y’s values and known x’s values.
Calculate the slope from this data: =SLOPE(A3:A22,B3:B22), and the output will be 2.7, as shown in the table below.

The output will be:
Example #2
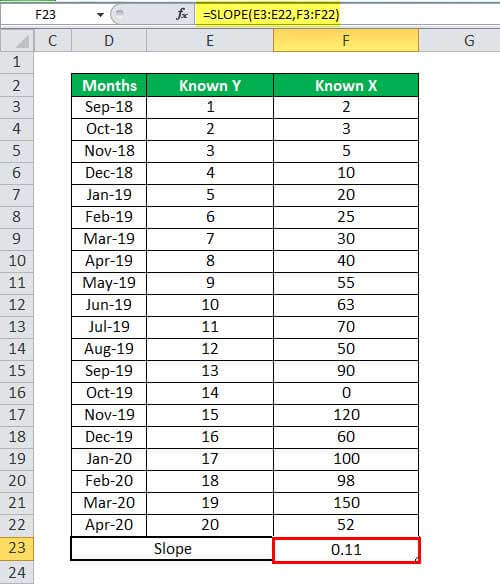
In the second example, we have month-wise data of known y’s value and known x’s value.
So here, we can apply the SLOPE formula in Excel as we used in the first example =SLOPE(E3:E22,F3:F22).

And the output will be 0.11, as shown in the below table.
SLOPE in Excel VBA
Suppose we have the X’s values in the Excel sheet range from A1 to A10, and Y’s in the given Excel sheet from range B1 to B10, then we can calculate the SLOPE here by using the below VBA functions.
Sub SLOPEcal() // start the slope function scope
Dim x, y as Range //declare the range x and y
set x = Range(“A10:A10”) //set known x’s values to range x.
set y = Range(“B10:B10”)//set known y’s values to range y.
slope = Application.WorksheetFunction.Slope(y, x) set
MsgBox slope // print the slope value in message box.
End sub // End the slope function
Things to Remember
- The SLOPE function through the #N/A! Error when the given array of known_x’s an array of known_y’s are of different lengths.
SLOPE Formula =SLOPE(A3:A12,B3:B15)

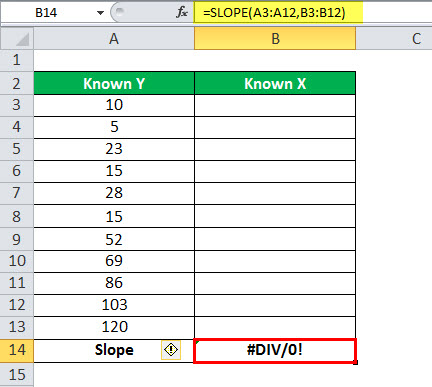
- The SLOPE function through the #DIV/0! Error when:
- The variance of the given known_x’s evaluates to zero. Or,
- Any given arrays (known_x’s or known_y’s) are empty.
- In the SLOPE function, if an array or reference argument contains text, logical values, or empty cells, the values are ignored. However, cells with zero values are included.
- In the SLOPE function, the parameters must be numbers or names, arrays, or references that contain numbers.
Recommended Articles
This article is a guide to the SLOPE Function in Excel. Here, we discuss the SLOPE formula in Excel and how to use the SLOPE function, along with Excel examples and downloadable Excel templates. You may also look at these useful functions in Excel: –