What is Standard Deviation in Excel?
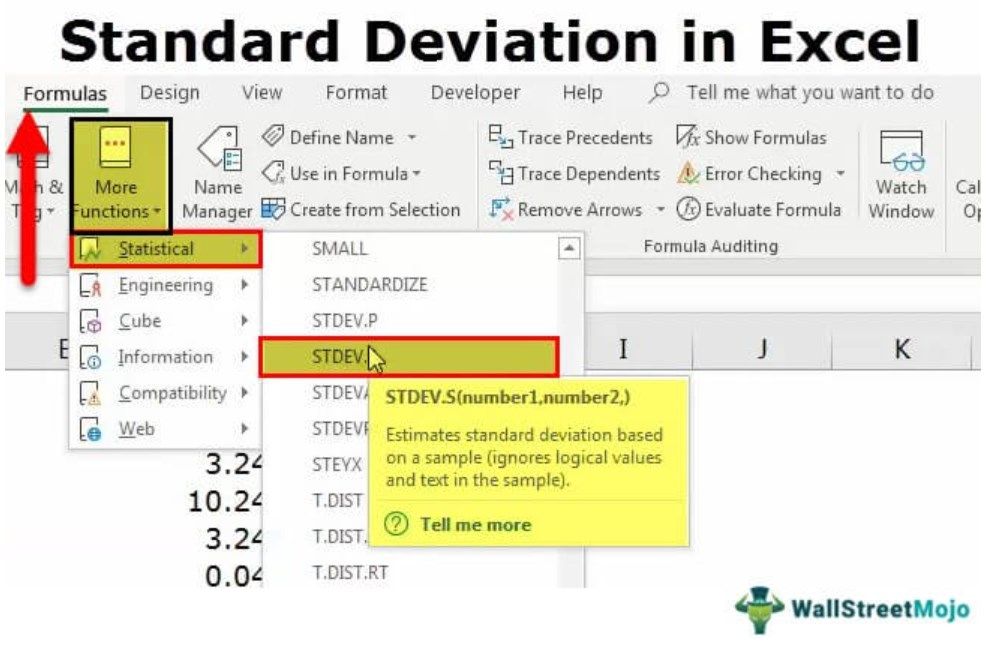
The standard deviation shows the variability of the data values from the mean (average). In Excel, the STDEV and STDEV.S calculate sample standard deviation while STDEVP and STDEV.P calculate population standard deviation. STDEV is available in Excel 2007 and the previous versions. However, STDEV.P and STDEV.S are only available in Excel 2010 and subsequent versions.
Standard Deviation Formulas in Excel
In excel, there are eight formulas to calculate the standard deviation. These are grouped under sample and population.
The functions STDEV.S, STDEVA, STDEV, DSTDEV are under sample and STDEV.P, STDEVP, STDEVPA, DSTDEVP are under population.

The Syntax of STDEV.S Function
The syntax of the function is stated as follows:
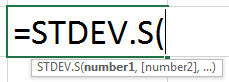
The function accepts the following arguments:
- Number 1: This is the first value of the sample data. It can be expressed as a range.
- Number 2: This is the second value of the sample data.
“Number 1” is mandatory and “number 2” is an optional argument.
Note 1: If the entire sample data is entered as a range, the “number 2” argument becomes optional.
Note 2: The sample standard deviation formula works correctly when the supplied arguments contain at least two numeric values. Otherwise, it returns the “#DIV/0!” error.
The Population vs. Sample
The population and sample are defined as follows:
- The population refers to the whole data set.
- A sample is a subset of the data set. A sample of the population is taken when it is difficult to use the complete data set.
Note: The sample standard deviation helps make conclusions for the population.
The STDEV.S and STDEVA Functions
The two functions are explained as follows:
- The STDEV.S function calculates the standard deviation using the numerical values. It ignores the text values. The “S” of the function represents the sample data set.
- The STDEVA function calculates the standard deviation by counting the text values as zero. The logical value “false” is counted as 0 and “true” is counted as 1.
Note: The STDEV.S is available in Excel 2010 and the subsequent versions.
Calculating Standard Deviation in Excel
#1 – Calculate Population Standard Deviation in Excel
Let us consider an example to understand the concept of standard deviation in Excel.
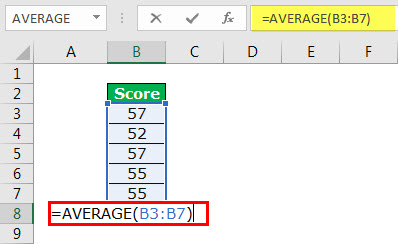
The following are the employee scores of an organization. They indicate the skill levels of the employees.
We want to calculate the standard deviation of the given data set.

The steps to calculate standard deviation in Excel are listed as follows:
- Calculate the mean (average) of the data.
The output 55.2 signifies the average employee score.
- Calculate the population variance. It is the difference of each score from the mean. The results are summed as shown in the following image.Variance =Variance =
The population variance is 3.36.

- Calculate the standard deviation. It is the square root of the variance.
Conclusion:The standard deviation is 1.83. This indicates that the employee scores range from 53.37 to 57.03.

#2– Calculate Sample Standard Deviation in Excel
Let us consider an example to understand the working of the STDEV.S function.
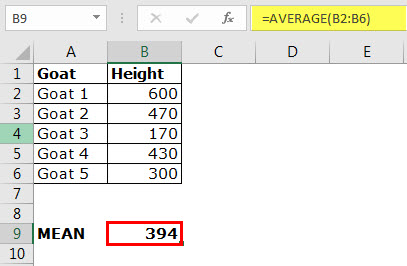
The following table shows the heights of different goats. The height is measured from the shoulder level and is denoted in millimeters.
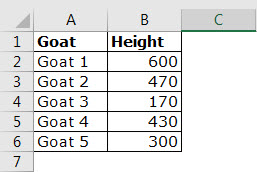
Step 1: Calculate the mean of the given data. The output is 394.
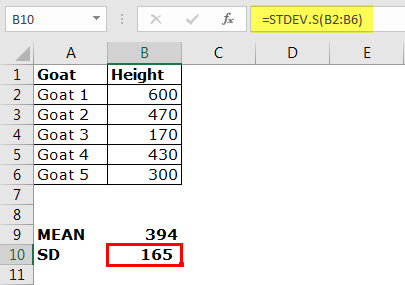
Step 2: Apply STDEV.S to the range B2:B6. The output is 165.
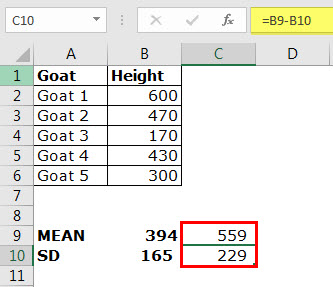
Conclusion: The standard deviation of the height of the goats is 165. This indicates that the usual heights are within the range of 229 and 559 millimeters.
In other words, the heights are on either side of the mean, i.e., 394–165=229 and 394+165=559.
Frequently Asked Questions (FAQs)
What is standard deviation in Excel?
The standard deviation measures the dispersion of a given set of values from the mean. It shows the fluctuation of data values. A low standard deviation indicates lower variability and greater accuracy of the mean. On the other hand, a high standard deviation indicates higher variation and lesser reliability of the mean.
While investing, the standard deviation of the returns is evaluated to assess the volatility of a stock. In Excel, the STDEV and STDEV.S calculate sample standard deviation while STDEVP and STDEV.P calculate population standard deviation.
Which standard deviation formula should be used in Excel?
To select the appropriate standard deviation formula, the following points must be considered:
• The standard deviation is being calculated for a population or sample.
• The type of values of the data set. These values can be numerical, logical or textual.
• The version of MS Excel which is being used currently.
How to create a standard deviation graph in Excel?
The steps to create a standard deviation graph in Excel are listed as follows:
• Create a usual Excel chart with the help of the “charts” group under the Insert tab.
• Select the chart and click the plus (+) sign on the top-right corner.
• In “chart elements,” click the arrow of “error bars,” and select “standard deviation.”
The standard deviation bars for the data points are inserted within the chart.
- STDEV calculates the standard deviation of the sample data supplied as an argument.
- The standard deviation shows the variability of the data values from the mean (average).
- The lower the standard deviation, the closer the data points to the mean.
- The higher the standard deviation, the more scattered the data points from the mean.
- The population refers to the entire data set while a sample is a subset of this data.
- The STDEV.S function calculates the standard deviation using the numerical values only.
- The STDEV.S function accepts two arguments–“number 1” and “number 2” representing the first and the second value of the sample data respectively.
Recommended Articles
This has been a guide to standard deviation in Excel. Here we discuss how to calculate standard deviation in excel using formula and examples. You may also look at these useful functions in Excel –