What Is Trendline Breakout?
A trendline breakout refers to a financial instrument’s price movement that breaches a trendline. This phenomenon helps traders spot entry and exit points, allowing them to benefit from the changing dynamics in the market. A breakout often indicates the reversal or weakening of the previous trend.
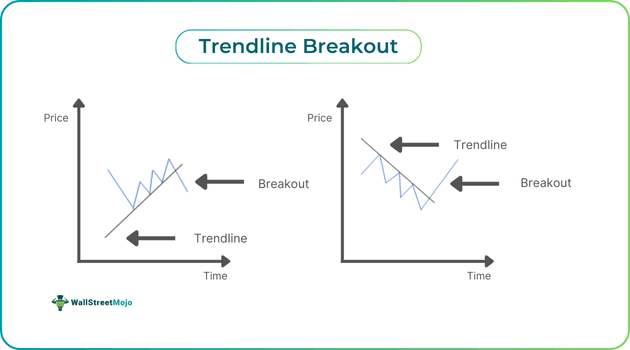
A breakout to the upside results in a price increase. On the other hand, a breakout below the trendline leads to a decrease in price. Hence, it is clear that a breakout always occurs on a trend’s opposite side. Usually, a trendline breakout confirmation depicts a change in the market sentiment, which, in turn, can result in trading opportunities.
Key Takeaways
- Institutional lending is loans offered by colleges and universities to their enrolled students for tuition and other educational expenses and fees.
- There are various benefits offered by this breach. For instance, it offers vital insights into market sentiment. Moreover, it can help individuals spot entry as well as exit points.
- A key part of an effective trendline breakout strategy involves placing a stop-loss order. It enables one to limit losses that may arise if the expected price movement does not occur.
Trendline Breakout Explained
A Trendline breakout is a phenomenon in technical analysis where an asset’s price crosses a trendline from above or below. Understanding the interpretation of this breach and knowing how to act upon it can help traders improve their performance in the market significantly.
Typically, when the breakout occurs in an uptrend, a potential downtrend is on the horizon. On the flip side, a breakout materializes when a financial instrument is in a downtrend, indicating a potential bullish reversal. Also, if a security’s price breaches a sideways trend, it is a sign that the consolidation phase might be over.
When making decisions based on this phenomenon, one must ensure to remain cautious regarding fake trendline breakouts. This is because a failed breakout or a fakeout can result in significant losses for those who execute a trade on the basis of the initial breakout. A fakeout happens when a security’s price breaks above or below a trendline but starts moving in the opposite direction, dropping below within the boundary of the trendline.
To avoid losses, traders must look for a trendline breakout confirmation, which can be a rise in trading volume, the formation of candlestick patterns and chart patterns, for example, the head and shoulder pattern, the double bottom pattern, etc. Individuals may also consider analyzing the price chart across different timeframes to steer clear of trading a fake trendline breakout.
How To Trade?
One must consider the following points to create and execute an effective trendline breakout strategy:
- Ensure the price of the asset breaches the upward or downward trend line.
- Use a technical analysis tool, for example, the trading volume, to ensure that strong volume accompanies the price movement above or below the trendline.
- Utilize an indicator to detect bullish momentum.
- Lastly, one can consider placing a stop loss at the lowest low or highest high of the previous two trading sessions to limit losses.
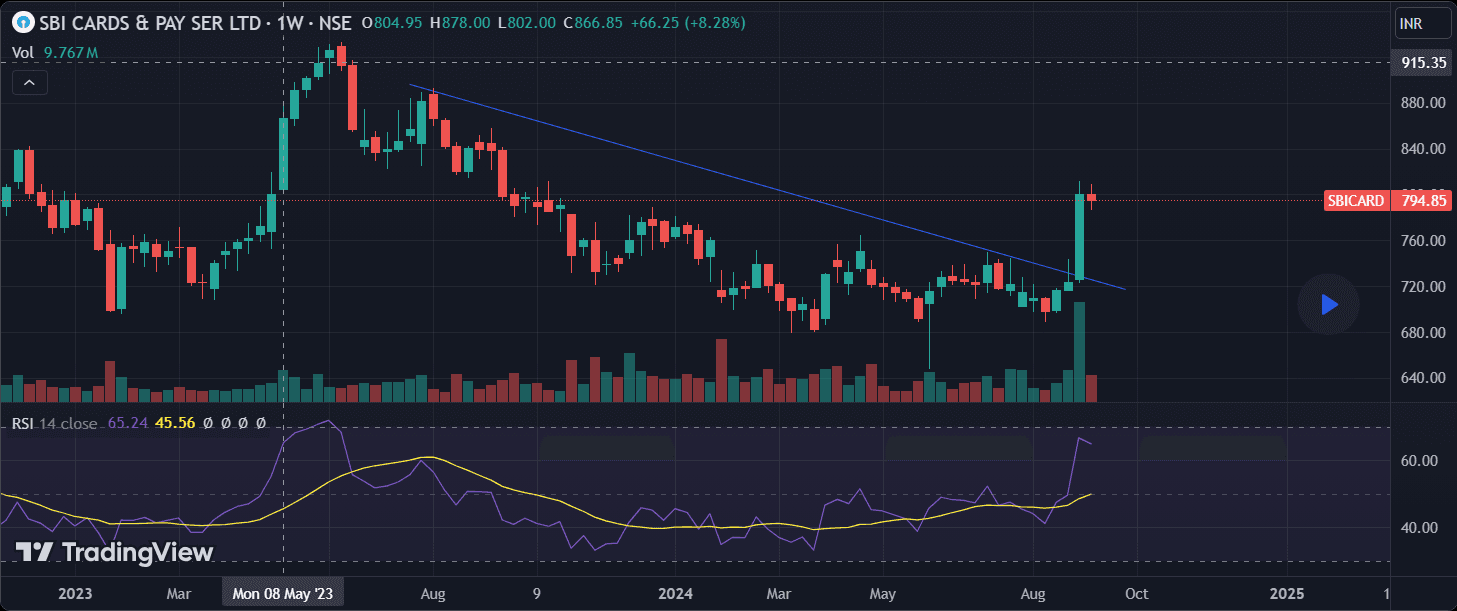
Let us look at the following weekly TradingVew chart of SBI Cards to understand the strategy better
Source: TradingView
In the above chart, the downward-sloping line shows that the stock was in a downtrend. Having said that, we can see a large bullish candle formed between September 2, 2024, and September 8, 2024, showing that the price breached the downward trendline. The close on the opposite side of the trendline, accompanied by a significant increase in the trading volume, serves as the trendline breakout confirmation.
Also, one can observe that the relative strength index or RSI rose above 60, indicating bullish momentum. This means that if a trader entered a long position after the breakout materialized, they would benefit from the uptrend. As part of their risk management strategy, they could place a stop loss order at the high of the preceding candle.
Examples
Let us look at a few trendline examples to understand the concept better.
Example #1
Suppose Jonathan, an equity trader, had Stock B on his watch list for more than a week. He observed the price chart and noticed that the stock price was in an uptrend. After a couple of trading sessions, the price started to drop significantly and breached the uptrend line, falling even lower. He noticed that a bearish candle formed at the end of the trading session as the price closed significantly below the trendline.
Jonathan checked the trading volume and noticed a significant rise, thus serving as a confirmation of the trendline breakout. Hence, he decided to enter a short position, hoping that the price would decrease further due to the strong bearish momentum indicated by an RSI of 40 following the breakout.
It turned out that Jonathan’s decision was correct as the price decreased further, generating significant gains for him.
Example #2
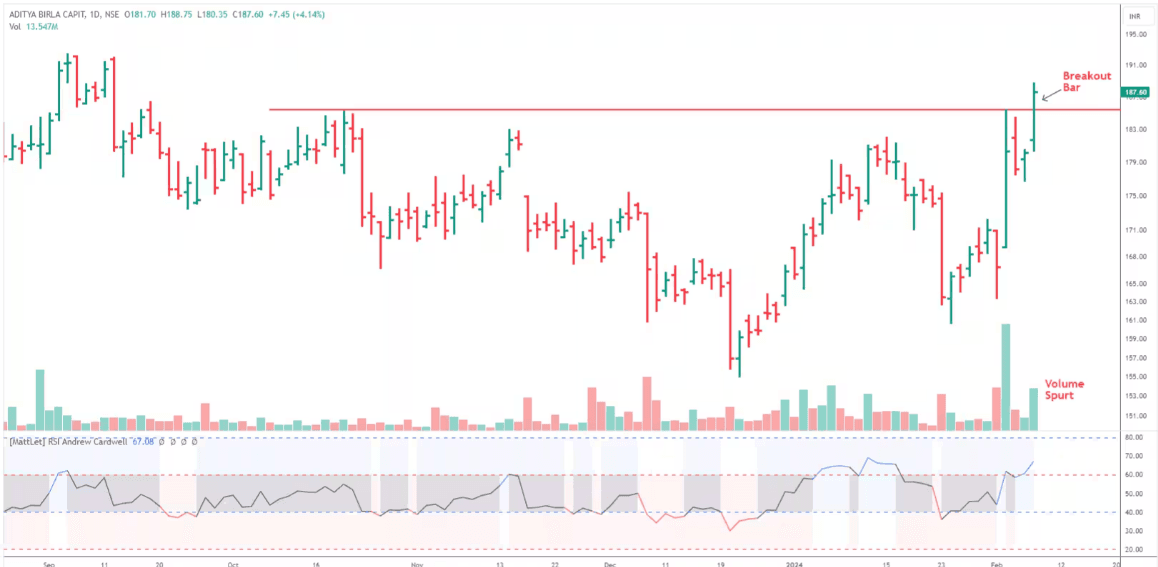
The shares of Aditya Birla Capital traded at Rs. 190.30, marking a 1.44% rise on January 8, 2024, at 10:30 am. The daily stock price chart displayed a horizontal trendline breakout, which was accompanied by high trading volume, as one can observe in the chart below:
Source: Moneycontrol
One must also note that the formation of a large bullish candle took place on the day of the breakout, which further added strength, according to Sudeep Shah of SBI Securities. The RSI was in a highly bullish zone, and the daily moving average convergence divergence remained bullish as well. Since the derivative and technical factors were aligning in buyers’ favor, Shah recommended traders accumulate shares of Aditya Birla.
Importance
One can go through the following points to understand the importance of this phenomenon:
- It can provide key insights into market psychology and market sentiment.
- The breakout can help traders identify entry or exit points.
- This phenomenon can help spot potential trend reversals.
- One can use it to trade different types of assets across different timeframes.
For professional-grade stock and crypto charts, we recommend TradingView – one of the most trusted platforms among traders.
Disclosure: This article contains affiliate links. If you sign up through these links, we may earn a small commission at no extra cost to you.
Frequently Asked Questions (FAQs)
What are a few mistakes I should avoid when trading a trendline breakout?
Some common mistakes one should try avoiding are as follows:
- Ignoring fundamental factors, for example, earnings reports, geopolitical developments, regulatory changes, etc.
- Letting emotions, such as greed, fear, etc., impact trading discipline, which results in impulsive buy and sell decisions.
- Overlooking confirmation signals and depending only on the trendline breach may result in poor decision-making.
When is the right time to seek a trendline breakout?
The right time to look for the phenomenon can be in the following cases:
- When a stock’s trading volume rises without its price displaying any volatility
- If stock is subject to price consolidation for quite some time
- When benchmark indices or the whole sector is in a phase that is extremely bullish
- If the price starts to scale high and no healthy corrections materialize
What is the difference between trendline breakout and bounce?
A trendline breakout materializes when an asset’s price breaks through the trendline. That said, in the case of a trendline bounce, the price touches the trendline and moves in the opposite direction.